Understanding DORA Metrics in OpenShift/Kubernetes Environments
Table of Contents
Introduction #
In today’s fast-paced world, software development and deployment are critical to success. DevOps practices have become increasingly popular to help teams deliver software more efficiently and with fewer errors. One way to measure the effectiveness of these practices is through DevOps Research and Assessment (DORA) metrics. In this post, we’ll explore what DORA metrics are, why they matter, and how they apply to OpenShift/Kubernetes environments. We’ll also provide example metrics for good and bad results and discuss the impact of these outcomes.
What Are DORA Metrics and Why Do They Matter? #
DORA metrics are a set of key performance indicators (KPIs) designed to evaluate the effectiveness of DevOps practices in software development and deployment. They were developed by experts from the DevOps Research and Assessment (DORA) team and provide valuable insights into the health and performance of an organization’s software delivery process. There are 4 key DORA metrics, outlined below, each falling within 1 of 2 areas within DevOps: Team Velocity or Stability.
DORA metrics matter because they can help organizations identify areas of improvement, prioritize changes, and track progress. By monitoring and analyzing these metrics, teams can optimize their software delivery process and ultimately deliver better products and services to their customers.
DORA Metrics in OpenShift/Kubernetes #
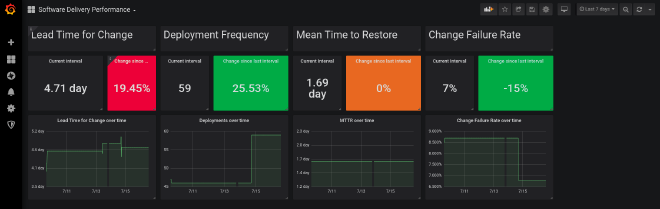
OpenShift, an enterprise-grade Kubernetes platform, offers various tools to help users monitor and manage their applications. These tools can be used to collect and analyze DORA metrics within an OpenShift environment. Below, we’ll discuss each metric and provide examples of what specifically is measured within an OpenShift platform.
1. Deployment Frequency #
Deployment frequency measures how often a team deploys code to production. In an OpenShift environment, this can be measured by tracking the number of deployments per application or project.
- Good result: Multiple deployments per day
- Bad result: Deployments occurring less frequently than once per week
High deployment frequency indicates that a team is able to quickly develop and deliver new features and bug fixes to their users. Conversely, low deployment frequency can be a symptom of bottlenecks in the development process, like manual testing or approvals.
2. Lead Time for Changes #
Lead time for changes measures the time it takes for a code change to move from the moment it’s committed to the version control system until it’s successfully deployed to production. In OpenShift, this can be measured by monitoring the time it takes for a new build to be deployed.
- Good result: Less than one day
- Bad result: More than one week
Shorter lead times indicate a more efficient software delivery process and a faster response to customer needs. Longer lead times may be a sign of inefficiencies in the development pipeline, such as lengthy code reviews or manual deployment processes.
3. Change Failure Rate #
Change failure rate measures the percentage of changes that result in degraded service or require a rollback. In OpenShift, you can track this metric by monitoring the success rate of deployments and rollbacks.
- Good result: Less than 15% of deployments result in failures
- Bad result: More than 30% of deployments result in failures
A low change failure rate indicates a team’s ability to deliver high-quality code and minimize disruptions to users. A high change failure rate may signal issues with the development process, like insufficient testing or unclear requirements.
4. Mean Time to Recovery (MTTR) #
Mean time to recovery (MTTR) measures the average time it takes for a team to recover from a failure or outage. In OpenShift, this can be measured by monitoring the time it takes to fix failed deployments or restore service after an outage.
- Good result: Less than one hour
- Bad result: More than one day
A short MTTR indicates a team’s ability to quickly detect and fix issues, minimizing downtime for users. A long MTTR may be a sign of issues with incident response processes or tooling.
Automate the measurement of organizational behavior
Conclusion #
DORA metrics are an essential tool for any organization looking to optimize their DevOps practices. By measuring deployment frequency, lead time for changes, change failure rate, and mean time to recovery, teams can gain a clear understanding of their software delivery process and identify areas for improvement. In an OpenShift/Kubernetes environment, these metrics can be collected and analyzed using built-in tools and features, helping teams deliver better software, faster.
References for Additional Reading #
- “Accelerate: State of DevOps” report by DORA
- OpenShift official documentation on monitoring and metrics
- “Introduction to DevOps Metrics” by Digital.ai
- “The Four Key Metrics to Measure DevOps Success” by Atlassian
- DevOps Research and Assessment (DORA) metrics | GitLab
- Book: “Accelerate: The Science of Lean Software and DevOps: Building and Scaling High Performing Technology Organizations” by Nicole Forsgren, Jez Humble, and Gene Kim